
There are a lot of built-in colors and ready-made palettes for R users — if you know how to find and use them. Here are some of my favorite tips and tools for working with colors in R.
How to find built-in R colors
There are more than 650 colors built right into base R. These let you use color names instead of hex or RGB codes. The color() function lists all of the color names, but that doesn’t help you see them.
There are websites and PDFs where you can view all the colors and what they look like. But why not use your own searchable table in R?
I built a package to do just that, which you’re welcome to download from GitHub using install_github() from the remotes or devtools packages:
remotes::install_github("smach/rcolorutils", build_vignettes = TRUE)
(Adding build_vignettes = TRUE as an argument to install_github() installs the package vignette, too.)
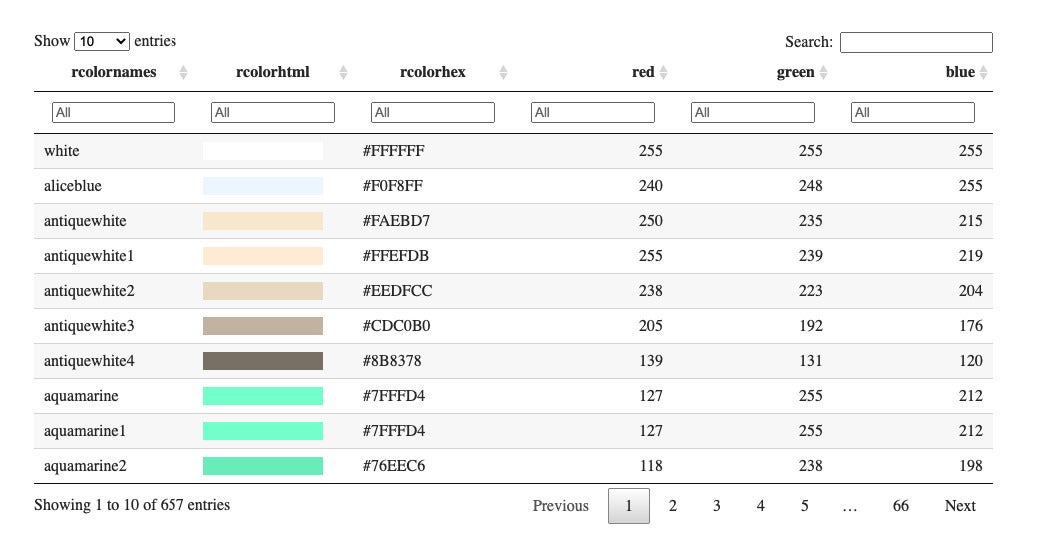
Load the package as usual and then run create_color_table() to display a sortable, search table of colors in R:
library(rcolorutils)
create_color_table(page_length = 10)
The create_color_table() function has one optional argument, page_length, which defaults to 25.
 Sharon Machlis, IDG
The create_color_table() function generates a table of built-in R colors.
While you can search by color names such as “blue,” not all blue-ish colors have “blue” in their names. That’s why I included columns for RGB red, green, and blue values, so you can sort and filter by those as well. At least your colors might end up in a more logical order than alphabetically by their names. To sort on more than one column at a time, hold down the shift key when clicking column names.
 Sharon Machlis, IDG
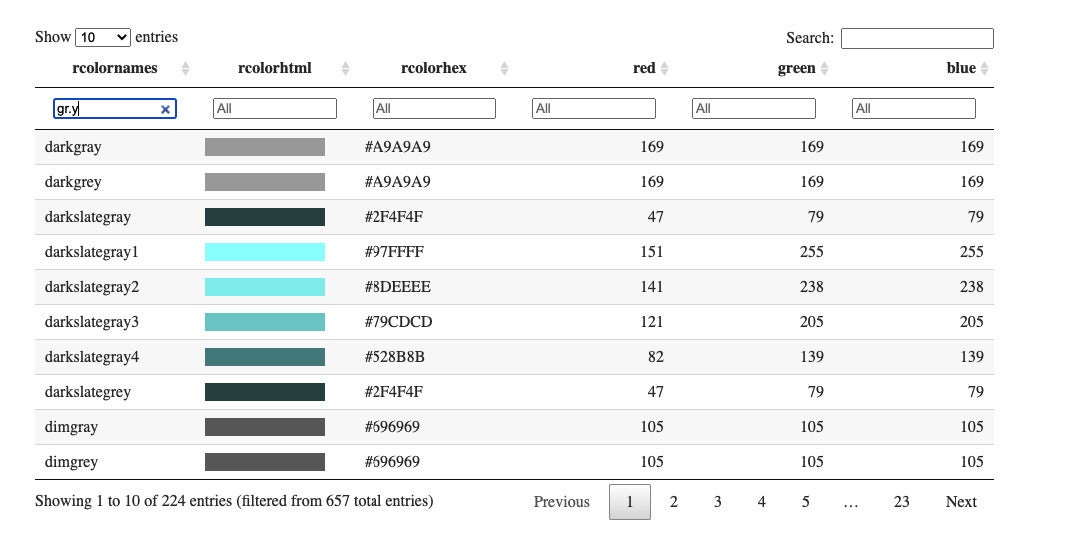
Searching for gr.y in the rcolorutils package’s color table.
The table allows you to search with regular expressions. For example, you can search for gray or grey by using a dot for “any letter” and searching for gr.y in the table. If you do that, you’ll see that some colors are repeated with gray and grey in their names. So, while there are 657 color entries in R’s built-in colors, there aren’t actually 657 unique colors.
How to search for ‘R colors like this one’
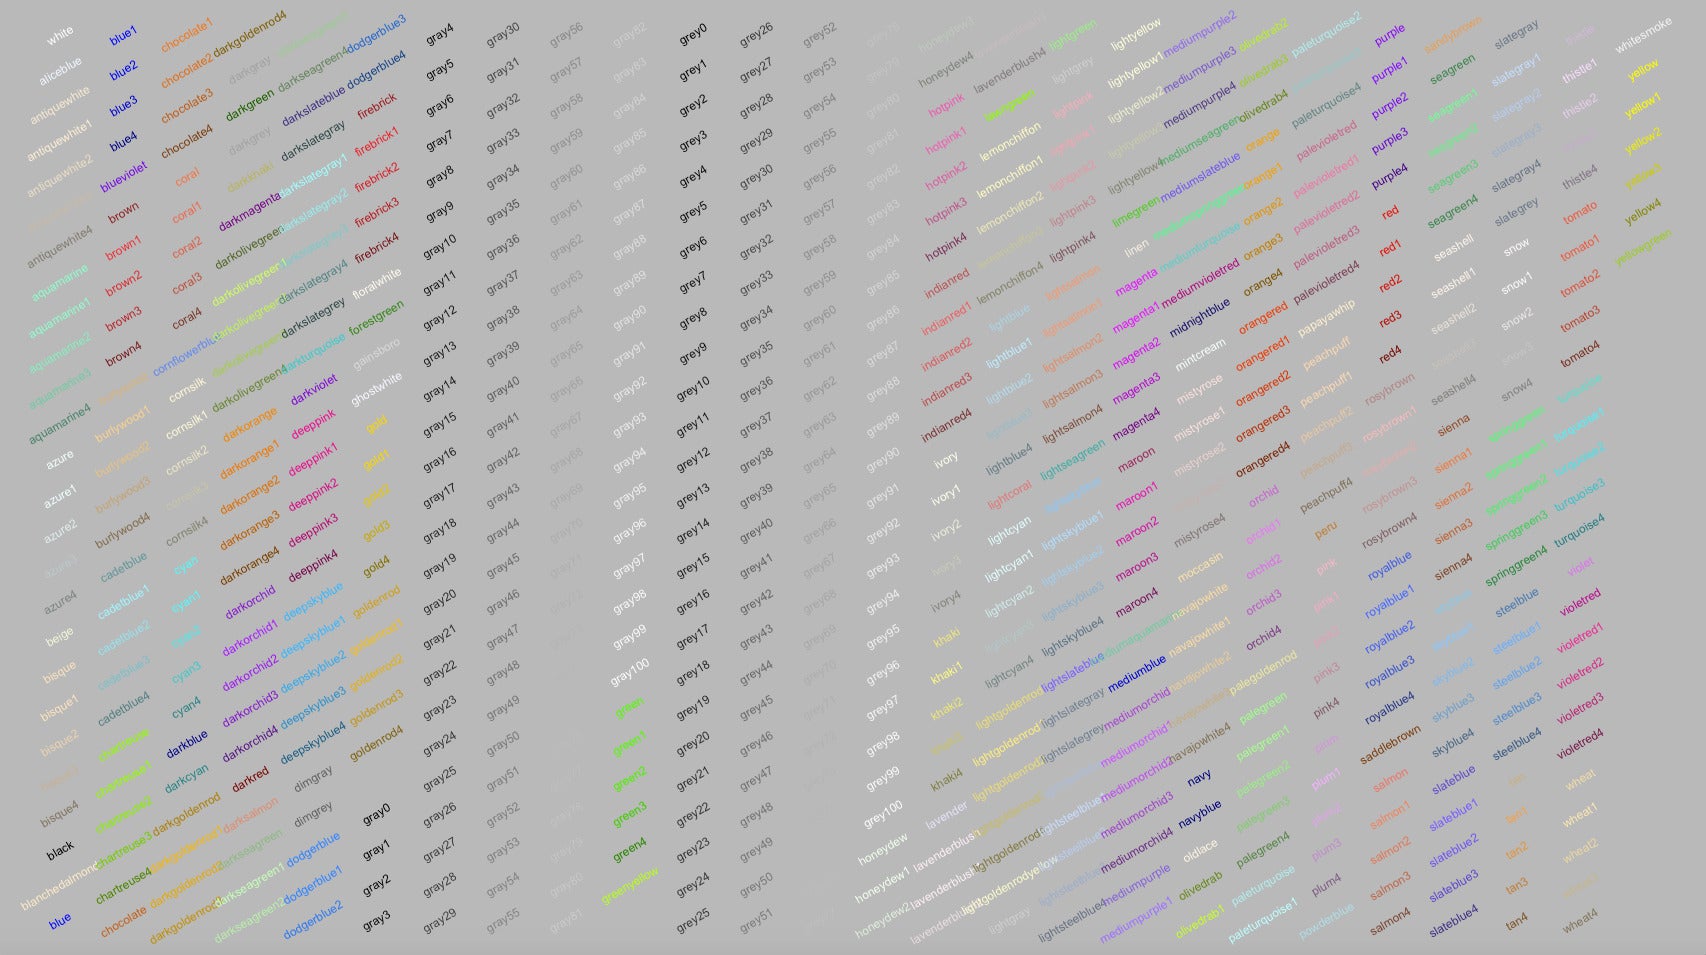
There is also a way to search for “colors somewhat like this specific color” without a table. I discovered this when running the base R color demo, which you can run locally with demo(colors).
The demo first shows some displays of built-in colors. I didn’t find those very useful since the colored text wasn’t too helpful for comparing colors.
 Sharon Machlis, IDG
Display of built-in colors when using demo(colors).
But if you cycle through those colored text displays, you’ll arrive at an option that says
## Now, consider choosing a color by looking in the
## neighborhood of one you know :
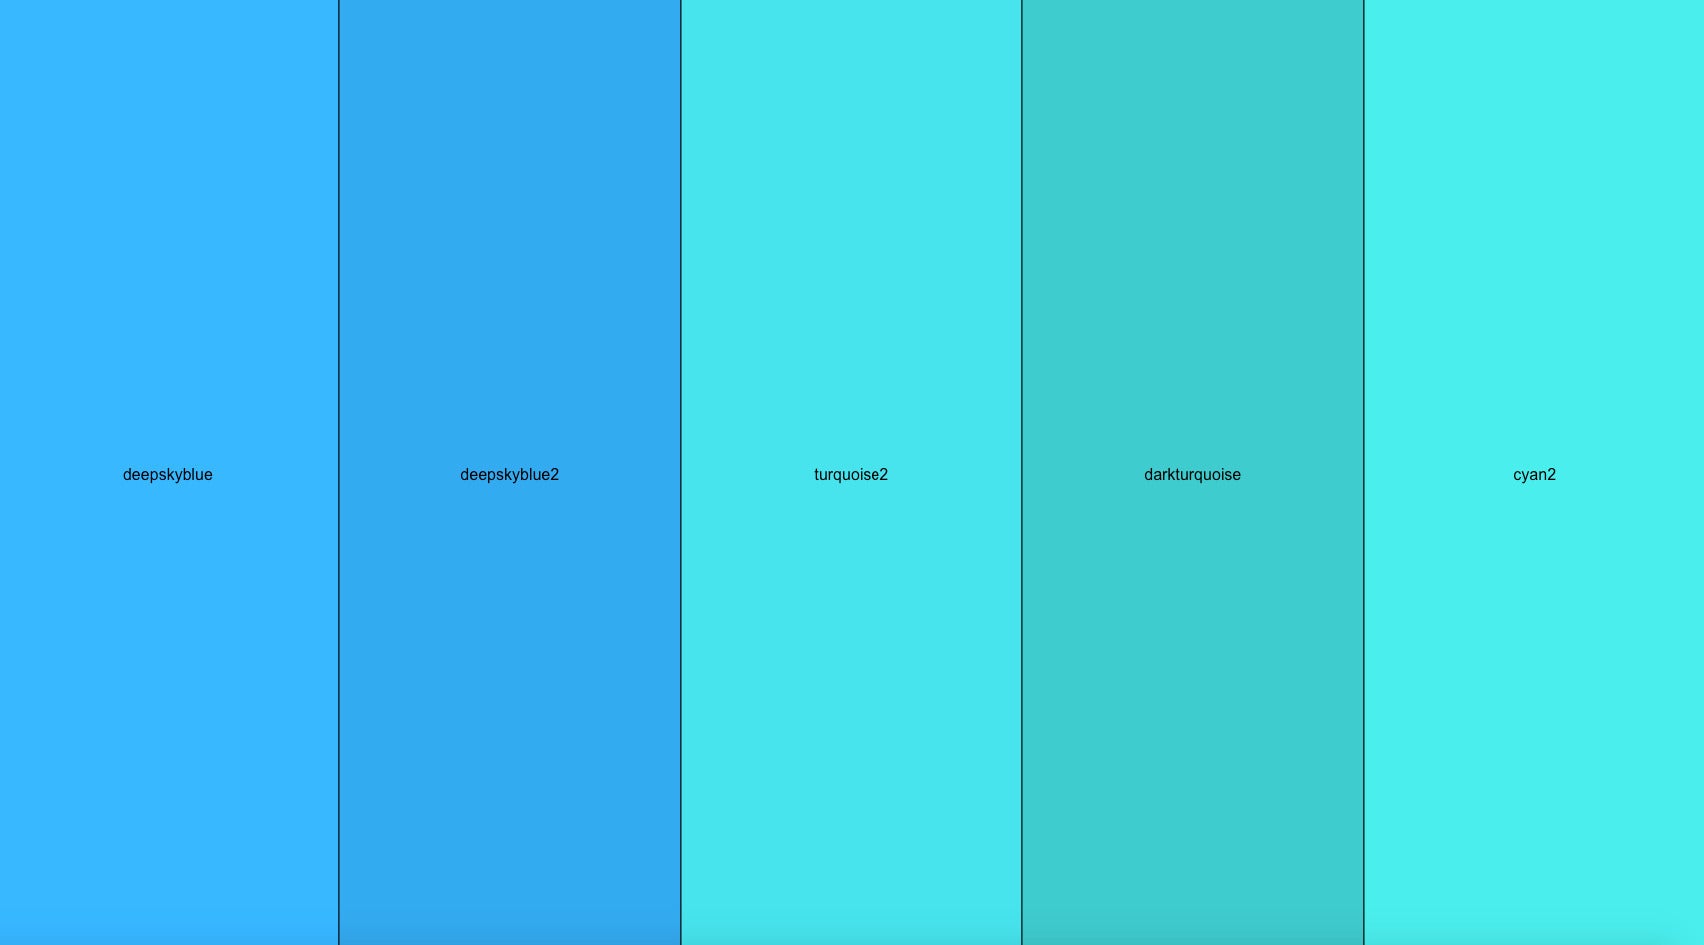
plotCol(nearRcolor("deepskyblue", "rgb", dist=50))
and a display such as below. That’s useful!
 Sharon Machlis, IDG
Blues similar to “deepskyblue.”
You could argue about just how blue these colors are compared with other choices, but it’s a start. Notice, too, that some have names like “cyan” and “turquoise,” which means you can’t find those in the table simply by looking for “blue.”
If you examine the code that generated the above image of five blue colors, you’ll see that there were two functions involved: nearRcolor() and plotCol(). I wasn’t able to access either of those functions in base R without running the colors demo. Since I’d like those functions without having to run the demo every time, I added code for both of them to my new rcolorsutils package.
If you run nearRcolor() on an R color name, you get a named vector with color information. You can then plot those colors with plotCol() — including setting the number of rows to display so all the colors don’t appear in a single row.
nearRcolor("tomato") 0.0000 0.0281 0.0374 0.0403 0.0589 0.0643 "tomato" "sienna1" "brown1" "coral" "coral1" "tan1" 0.0667 0.0723 0.0776 0.0882 0.0918 0.0937 "tomato2" "sienna2" "brown2" "coral2" "tan2" "firebrick1" plotCol(nearRcolor("tomato"), nrow = 3)
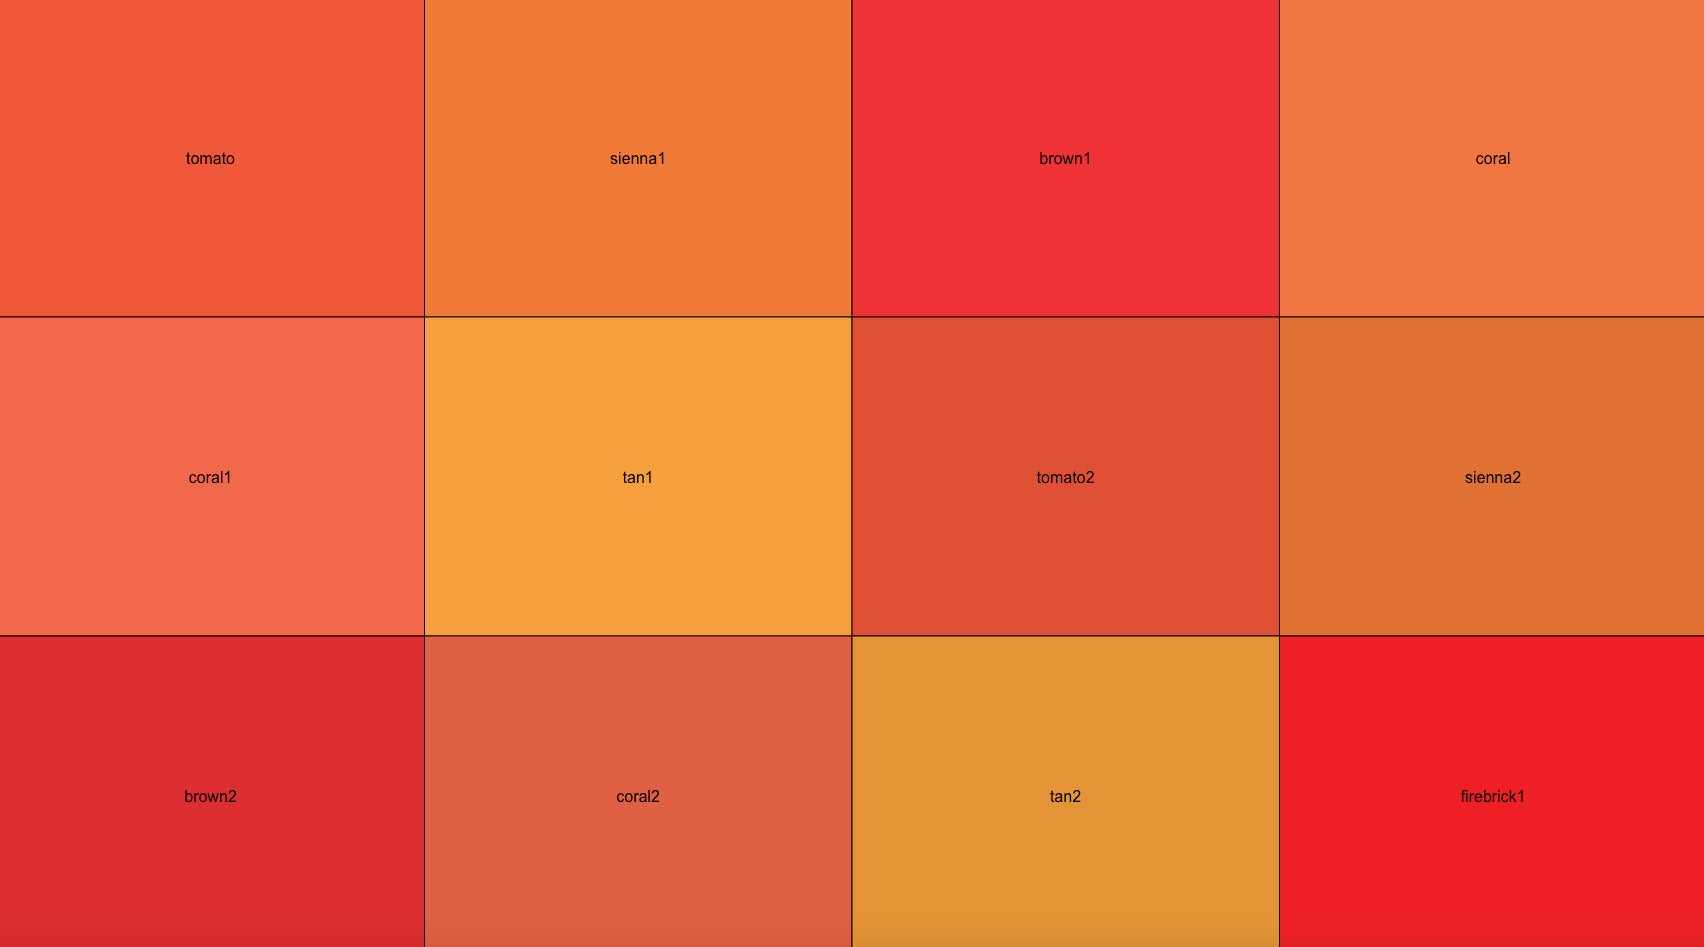 Sharon Machlis, IDG
Plot with three rows of colors close to “tomato.”
If I look for colors near “blue” I don’t get too many returned:
 nearRcolor("blue")
0.0000 0.0667
"blue" "blue2"
I can change how many results I get back by setting a custom rgb distance. What distance is best to use? I just fiddle around with the distance integer until I get roughly the number of colors I’d like to see. For example, using %>% pipe syntax and a distance of 135:
nearRcolor("blue", "rgb", dist = 135) %>%
plotCol(nrow = 3)
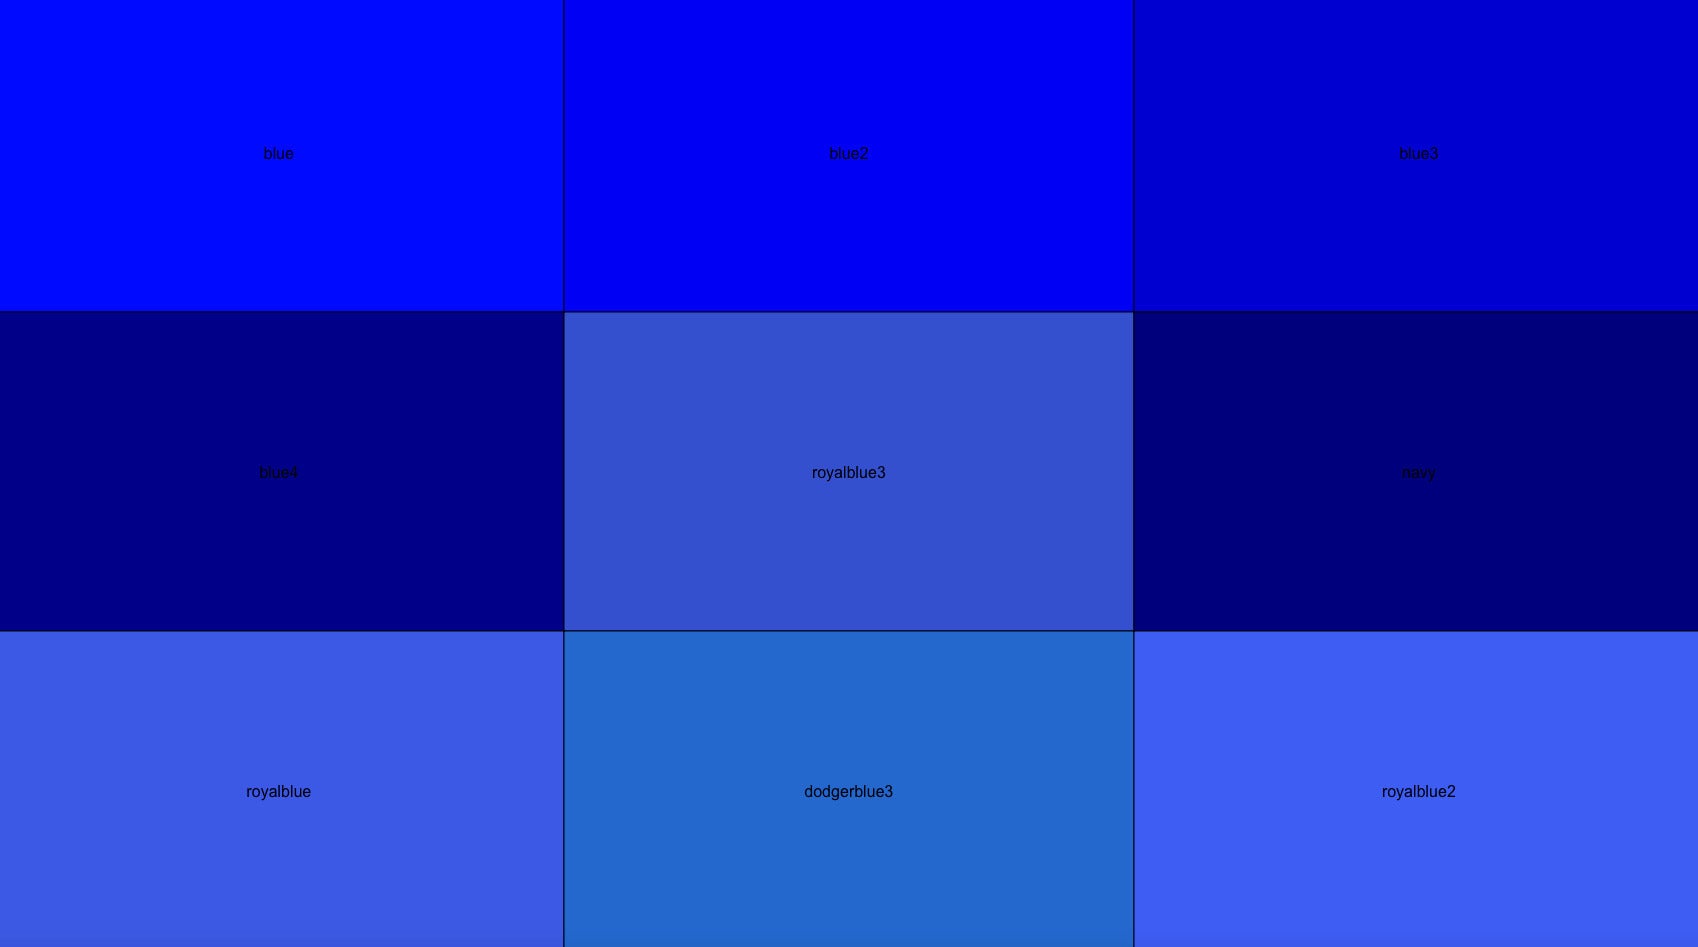 Sharon Machlis, IDG
Colors near blue with a custom distance.
The scales package also has a nice function for plotting colors, show_col(), which you can use instead of plotCol():
nearRcolor("blue", "rgb", dist = 135) %>%
scales::show_col()
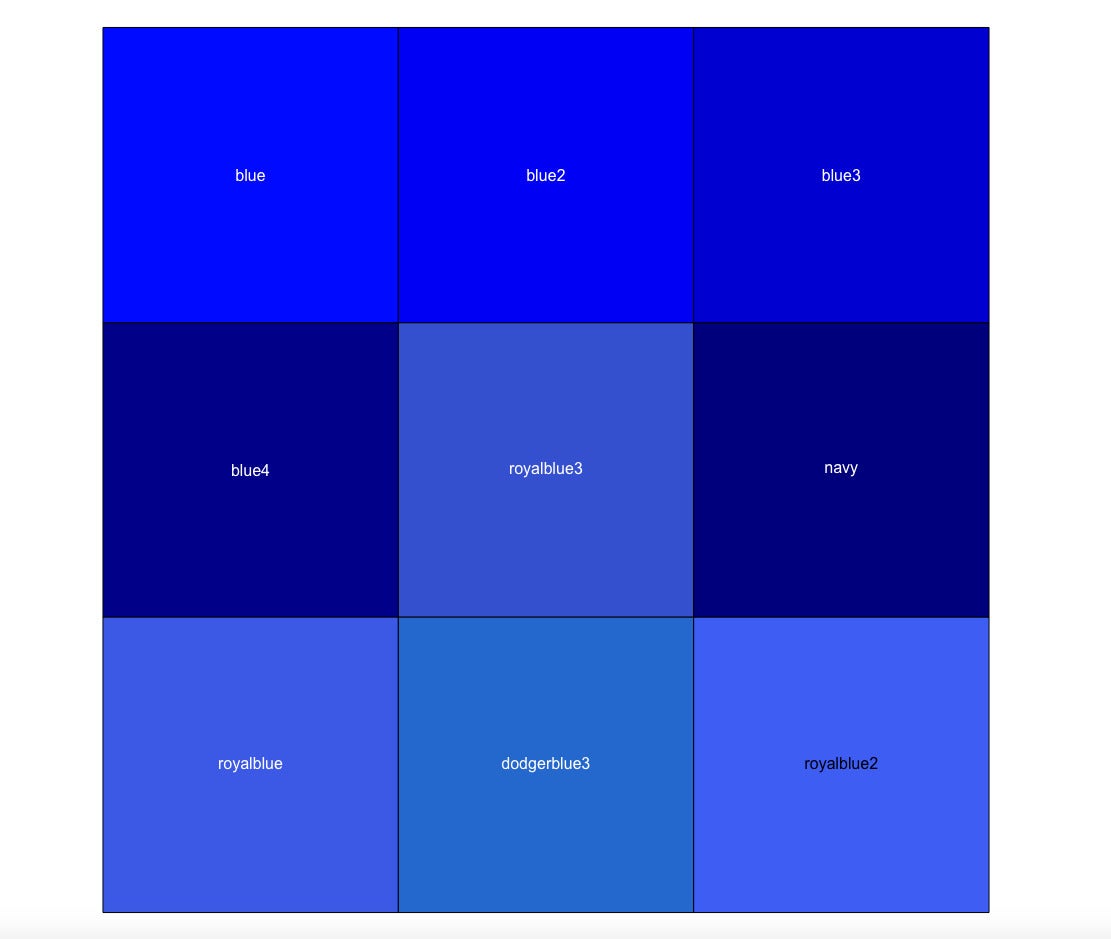 Sharon Machlis, IDG
The show_col() function’s results for colors near “blue.”
What’s nice about show_col() is that it determines whether text color would look better as black or white, depending on the color being displayed.
How to find and use pre-made R color palettes
There are a few color palettes built into base R, but probably the most popular come from the RColorBrewer and viridis packages. You can install both from CRAN.
If you also install the tmaptools package, you’ll get a great built-in app for exploring both RColorBrewer and viridis palettes by running palette_explorer().
The app lets you choose the number of colors you want, and you can see all available palettes within that number. The app includes sample code for generating the palettes, as you can see below each palette color group. And it even has a color blindness simulator at the bottom right.
 Sharon Machlis, IDG
The tmaptools package’s palette_explorer app.
These may be all the palettes you’ll ever need. But if you’re looking for more variety, there are other R packages with pre-made palettes. There are palette packages inspired by Harry Potter, Game of Thrones, Islamic art, U.S. national parks, and lots more. It can be hard to keep track of all of the available R palette packages — so the paletteer package tries to do that for us. Paletteer includes more than 2,000 palettes from 59 packages and classifies them into three groups: discreet, continuous, and dynamic.
I find it a bit difficult to scan and compare that many palettes. So, I made a Shiny app to see them by category.
You can download the code for this app if you’d like to run it on your own system:
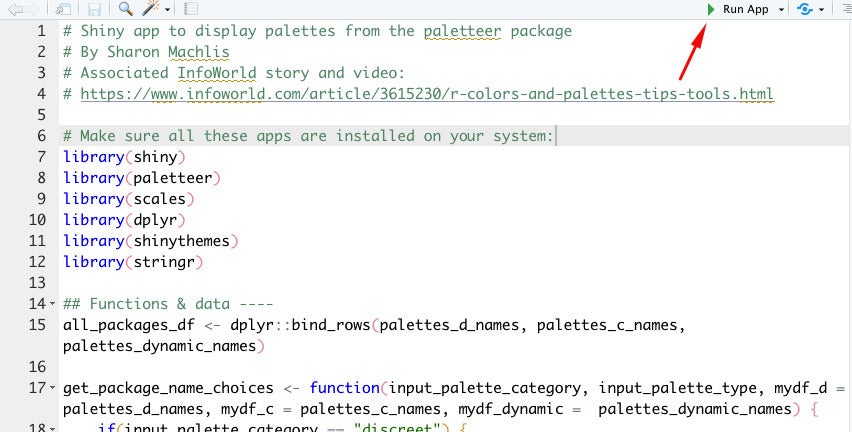 Sharon Machlis
Run a Shiny app in RStudio by clicking the Run App green triangle
Change the file name from app.txt to app.R, make sure you’ve installed the necessary packages, and then run the app in RStudio with the “run app” button.
The app lets you search for palettes by category: continuous, discreet, or dynamic. Then pick the type you want, i.e., colors that diverge, colors that are in sequence, or colors that are qualitative without any sort of order. These palette classifications come from the paletteer package and a few of them might not be exact, so I tend to look at all three types to make sure I’m not missing anything I might like.
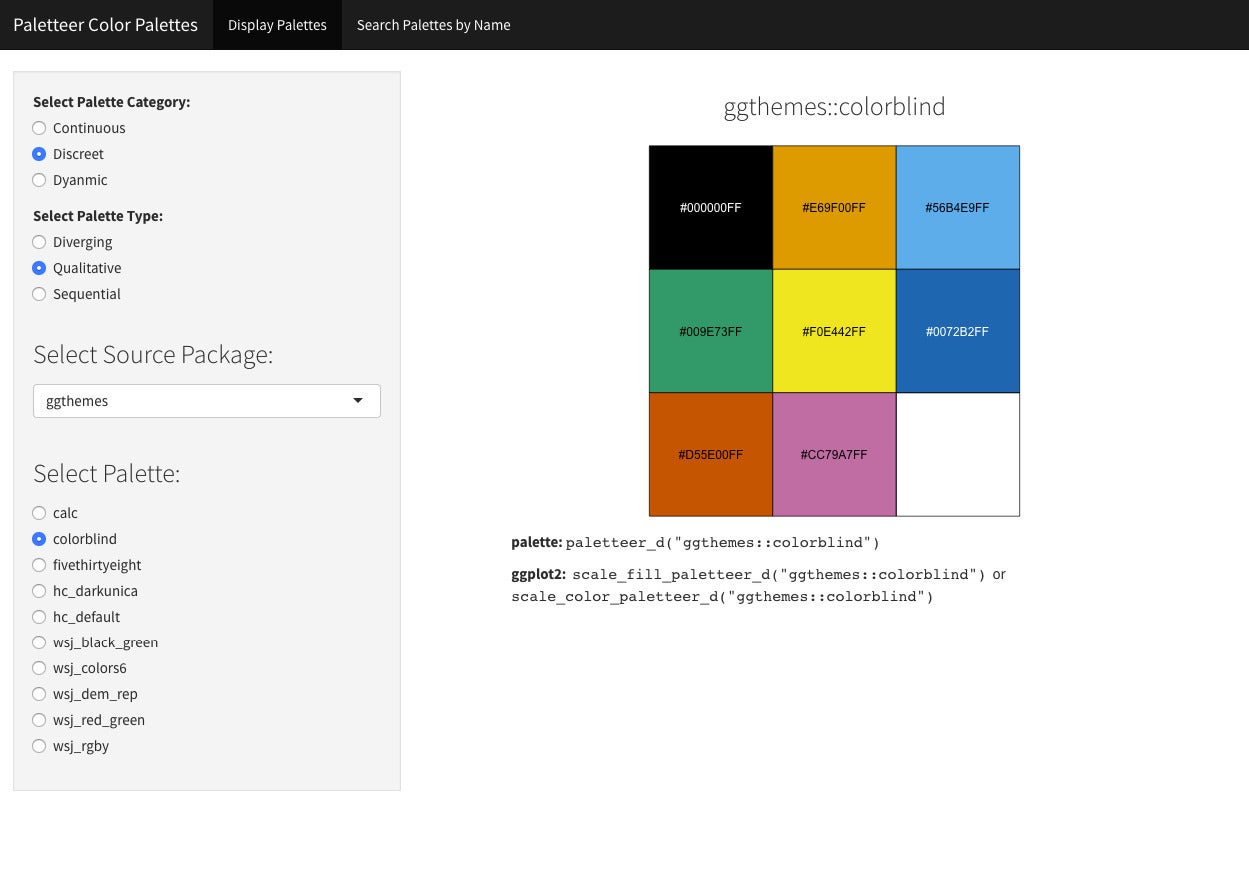 Sharon Machlis, IDG
Shiny app for displaying palettes included in the paletteer package.
Under each color image is code for how to use the palette. The first line of code shows how to access the vector of hex codes in the palette; the second one shows how to use it in ggplot with scale_fill_paletteer() or scale_color_paletteer() geoms. You can see how this works in the video embedded at the top of this article.
Make your own R palette and palette function
Sometimes you’ll want to make your own color palette, either because you’ve combined your own colors in a scheme you like or because you need to match your organization’s approved colors.
You can use any color hex codes within ggplot2::scale_fill_manual(). However, it’s much more elegant to create my own scale_fill() function similar to ggplot2’s built-in ones. The paletti package makes it very easy to do this.
Here’s how it works. First run the get_pal() function on your vector of colors to create a palette from them. Then run either get_scale_fill() or get_scale_color() on the results to turn the palette into a ggplots function, such as
library(paletti)
my_colors <- c("#b7352d", "#2a6b8f", "#0f4461", "#26aef8")
scale_fill_my_palette <- get_pal(my_colors) %>%
get_scale_fill()
# OR
col_fill_my_palette <- get_pal(my_colors) %>%
get_scale_color()
Now I can use my new scale_fill_my_palette() or col_fill_my_palette() function in a ggplot, as you can see with this plot of some toy data:
library(ggplot2)
toy_data <- data.frame(
Category=c("A","B","C","A", "C") ,
xval=factor(c("Mon", "Tue", "Wed", "Thur", "Fri"), levels = c("Mon", "Tue", "Wed", "Thur", "Fri"), ordered = TRUE) ,
yval=c(255,500,459,342, 386)
)
ggplot(toy_data, aes(x = xval, y = yval, fill = Category)) +
geom_col() +
xlab("") +
ylab("") +
theme_classic() +
scale_fill_my_palette()
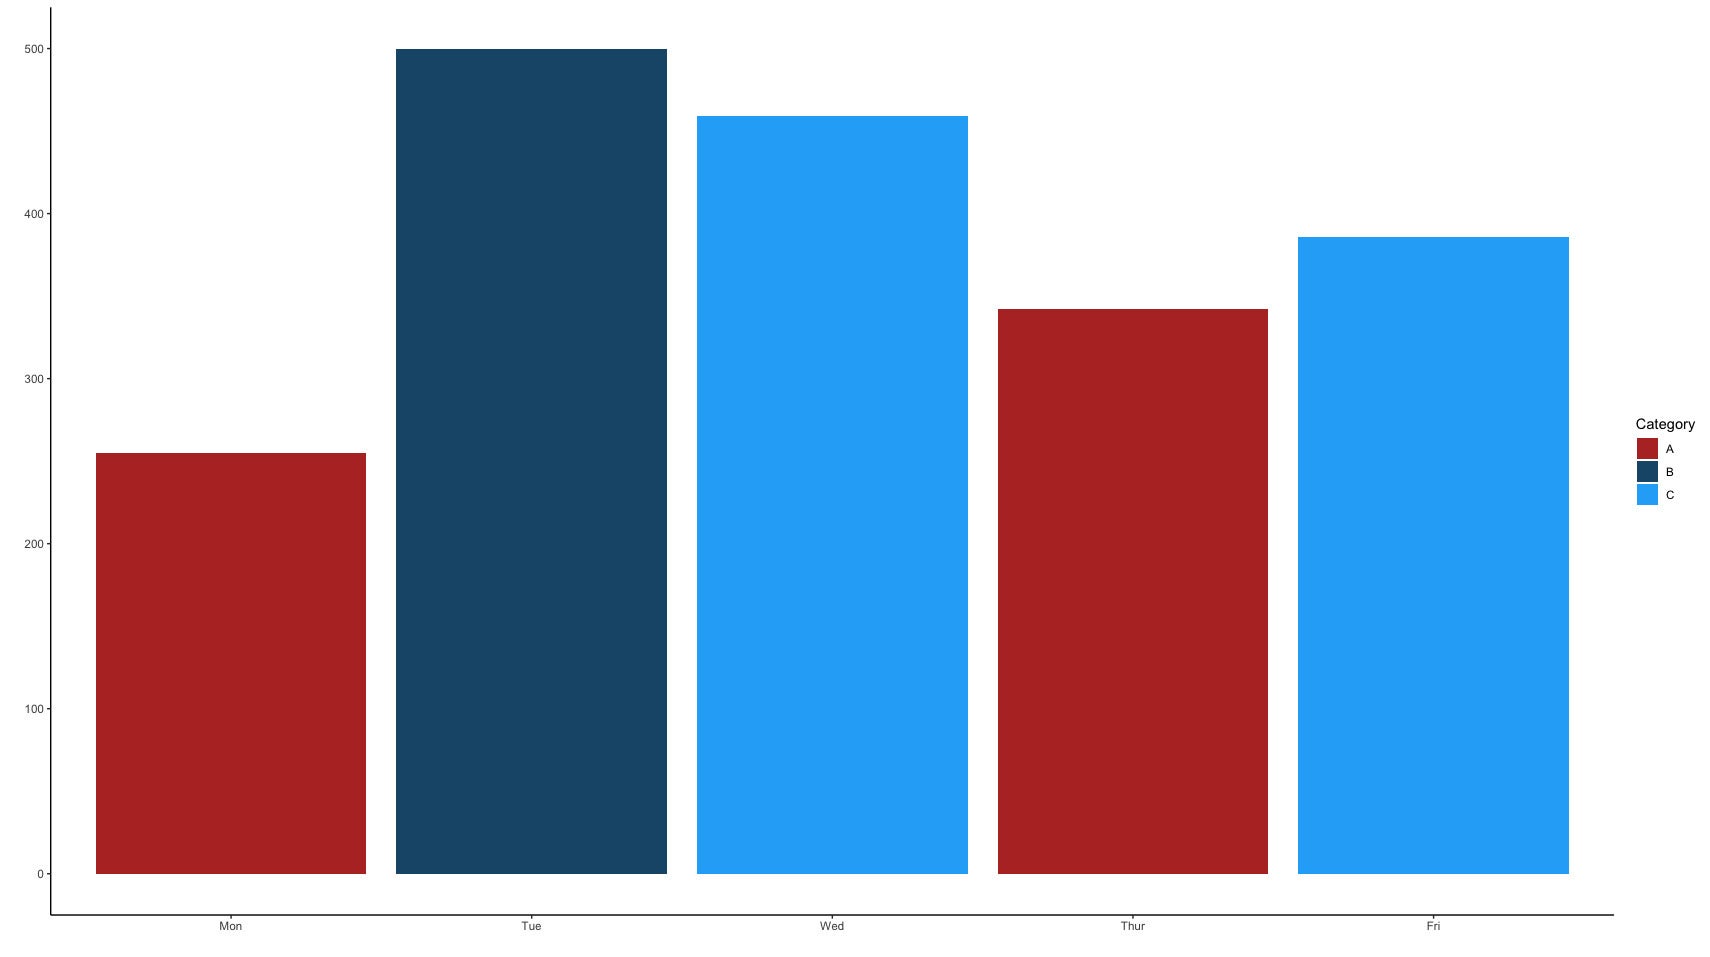 Sharon Machlis, IDG
Plot with custom palette.
Want more R tips and tutorials? Head to my Do More With R page.